| News |
| Latest news | |
| Int’l Cooperation activities | |
| Events & Announcement | |
| Recent Activities |
| Location: Home>News>Recent Activities |
| GRL: Obvious lateral variations of shear-wave velocity in the D” layer beneath the Indian-Eurasian plate collision zone |
The core-mantle boundary (CMB) near 2900 km depth is formed due to the transition between the solid silicate lower mantle and the liquid iron-nickel outer core. It is the most heterogeneous layer in the earth with rapid variations in temperature and chemical composition. It is also the origin of mantle convective upwelling magma and final destination of subduction plate fragments. Therefore, studies of the CMB structure provide constraints on the plate motion and the mantle convection. Since the initial separation of the Gondwana continent in the Southern Hemisphere during the early Mesozoic, the formation of Tibetan Plateau has experienced a long history of tectonic evolution. Previous studies indicate that the seismic wave speed is relatively high in the lowermost mantle right above the CMB (i.e., the D'' layer) beneath East Asia, the commonly used tomographic images have an observation accuracy of about 1,000 kilometers in this area (Figure 1a). Recently, Prof. Ling Bai from the Institute of Tibetan Plateau Research, Chinese Academy of Sciences has led a study to image the small-scale structure of the D'' layer beneath the India-Eurasian plate collision zone. This study is mainly based on the waveform data of eight earthquakes in the Indian Ocean recorded by the dense China Digital Seismic Network (Figure 1b), and the cross-correlation method with respect to the 3D theoretical waveforms of the CMB reflections (ScS, see the upper left corner of Figure 1b). Approximately 1000 high-quality ScS-S travel time residuals δt3D are obtained. These time differences show a lateral change of up to 10s, indicating that within a horizontal range of about 300 km at the D'' layer, the shear wave velocity has a lateral change of up to 3-7% (Figure 2), which is significantly larger than that obtained by previous seismic tomographic image with changes within 0-1.5%. This study supports the previous works in seismic tomography, geochemistry and laboratory experiment that the dominated high velocity anomalies beneath the Tibetan areas are associated with the subduction of the Neo-Tethyan and Pacific plates and the Paleo-Tethyan and Paleo-Pacific plates. The results further indicate that there are small-scale low-velocity anomalies in the southeast and northwest parts of the study area, indicating that the formation of the CMB is affected not only by the subduction of the oceanic plates, but the interactions of the outer core and the lowermost mantle as well. This study revealed a shear-wave velocity variation of up to 7% over a distance about 300 km at the D'' layer in the continental collision zone, which provide a new constraint on the understanding of the temperature and chemical structure of the CMB area and the revolution history of the Tibetan Plateau and its surrounding areas. This work has recently been published in Geophysical Research Letters, entitled “Lateral variations of shear-wave velocity in the D" layer beneath the Indian-Eurasian plate collision zone”. This research was supported by the National Natural Science Foundation of China (41761144076) and K. C. Wong Education Foundation (GJTD-2019-04) to Ling Bai, National Natural Science Foundation of China (41804083) and China Postdoctoral Science Foundation (2018M641490) to Guohui Li and the National Science Foundation (EAR-1644829) to Jeroen Ritsema. Full text link:Li, G., Bai, L., & Ritsema, J. (2020). Lateral variations of shear‐wave velocity in the D″ layer beneath the Indian-Eurasian plate collision zone. Geophysical Research Letters, 47, e2019GL086856. https://doi.org/10.1029/2019GL086856. 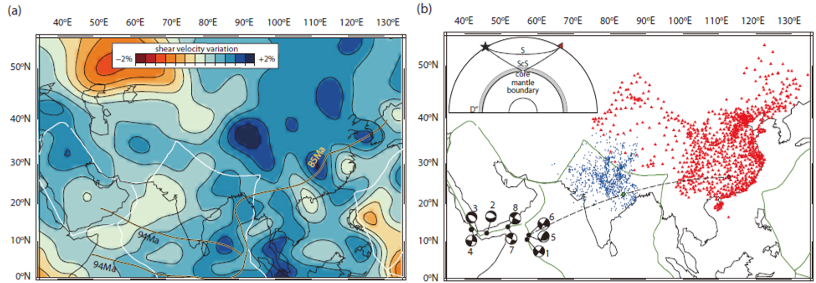 Figure 1. (a) Map of the variation of shear velocity in the lowermost mantle beneath southern Asia according to model S40RTS. (b) Map showing the locations of the eight earthquakes (black circles for the locations; beach balls for the focal mechanisms) and the China Digital Seismic Network stations (red triangles). The inset in the upper-left corner shows the S and ScS rays. 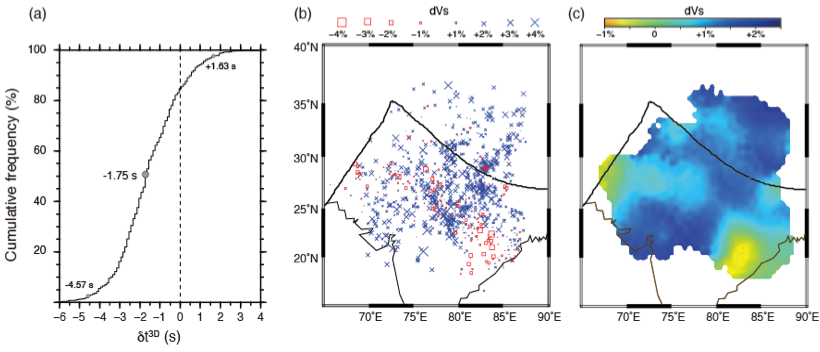 Figure 2. (a) Cumulative frequency histogram of δt3D. The median value of δt3D is -1.75 s and 95% of the values fall between -4.57 s and +1.63 s. (b) Values of dVs plotted at the CMB reflection points of ScS. (c) Map of dVs after cap smoothing using caps with radii of 2o and cap centers spaced every 0.5o. |